I found this argument on CNBC between some smart traders that caught my eye this morning. Rick Santelli knows whats going on.. Economic Panel: Oil soars to a record near $147, with Jack Bouroudjian, Brewer Investment Group; Mad Money host Jim Cramer and CNBC's Rick Santelli. CNBC Video Link
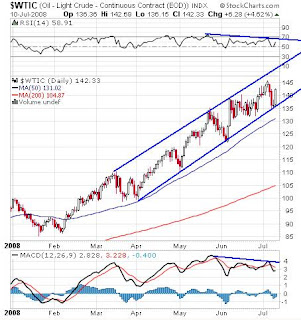
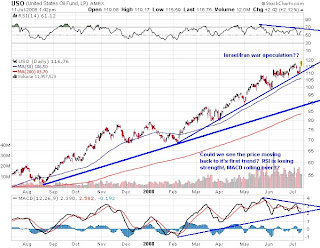
I'm going to look at the Light Sweet Crude Contract, USO, XLE, Charts and Option Activity.
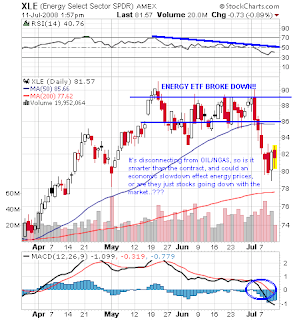
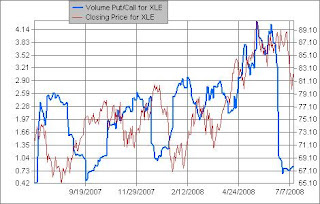
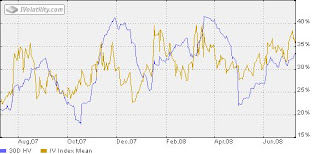
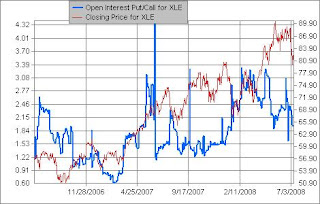
The next charts I've enclosed are the Implied Volatility Index Mean vs. Historical 30 Day Volatility and Put/Call Volume Ratios vs. Stock Price. It seems that the XLE I-Volatility is pretty much at the 30 day historical level, and they've moved up . You can see that historical volatility rallied hard when crude oil went from $110 in May to $145. It seems there are huge disconnects between the XLE and current oil contracts. Today its Implied Volatility is at 36% and historical is at 33%, close to year highs but complacent. The last two times volatility hit around 40 it was during deep XLE corrections and volatility was expensive and sold. Implied Volatility had the pattern of bottoming out in the 20s and topping out the stock. Could implied volatility break out to new highs extending corrections? Today Oil rallied to $147 based on middle east feuds, however the XLE is currently down a few percentage points. It's odd, but maybe the stocks are factoring in business and systemic risk factors. If the middle east feud simmers down and there is demand destruction, it could bring oil back to $100 in the next 2 years like T. Boone Pickens suggested and XLE Implied Volatility could break out positioning XLE for a long term trade to the downside. Also you can see that the Put/Call Volume Ratio decreased dramatically recently while XLE was topping out before the stock plunged 11% in July, but short interest in the beginning of July increased 16.75% to 72 million from 62 million in mid June. Also, the Put/Call Open Interest Ratio trend looks to be falling but put sentiment is still about 2x calls and could spike at any moment.


0 comments:
Post a Comment