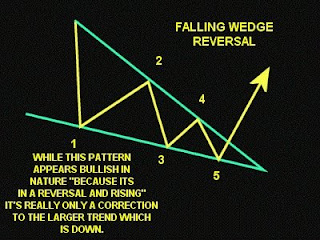
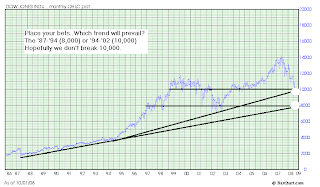
Looking strictly at the technicals, 10,000 is the next major whole number for support as well as the 2004 and 2005 lows. On Friday the Dow closed at 10,325, breaking last week's low of 10,365 when the Dow lost 777 points in one day. So that breach might mean we continue lower, of course it all depends on how traders digest the bail out. Looking at the chart, it seems the Dow is in a falling wedge pattern in an underlying downtrend. Usually these patterns predict a corrective reversal but requires some sort of catalyst for the wedge to squeeze the crowded trade, which is around 10,250 on the chart. However, eventually the long term trend prevails, and if there is a corrective reversal I'd like to see a successful re-test of the reversal point to tell if we're ready for an uptrend. If there are serious issues with our economy, the Dow could break down from that wedge and test 10,000, which is where the '94-'02 trend hits today. Any type of correction could be delayed due to the short sale ban affecting a squeeze, or institutional capital staying on the sidelines. There is also a second trend which tracks the lows of '87 and '94, and it hits today at about 8,000. So hopefully the state of our economy is almost priced into the indices and we don't break below 10,000...And hopefully the Fed doesn't have to subsidize the labor force!
Dow Index: Falling Wedge (Source: Barchart.com)

Description of Falling Wedge Reversal (Source: Sharp2be)
Dow Index: 25 Year Chart w/ Trends (Source: Barchart.com)
I also posted about this on Sep 13, 2008,
http://distressedvolatility.com/2008/09/long-term-dow-s-technicals-near-term.html.


3 comments:
I heard some mention that the long term (10 year) S&P chart looks very bearish and indeed it does.
Yea, here's a post a while back where I charted the same trends for the S&P 3 weeks ago.
http://distressedvolatility.com/2008/09/long-term-dow-s-technicals-near-term.html
It looks like S&P sees major support at 1,050 Or 1,000 being the flashy whole number for traders. We'll see though, if things really get bad we'll retest the tech bubble lows of 800, that would be very low. Today we're sitting at levels seen in 1998! 10 years of no growth, wow.
Good post! On the SPX, I agree with 1,000 as the mark to hit. I posted about it this morning with a 20 year view.
http://mytradersjournal.com/stock-options/2008/10/05/sp-500-20-year-chart-october-3-2008/
Post a Comment