
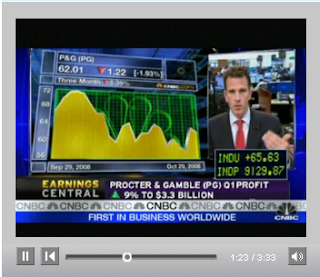
Procter & Gamble's earnings just came out on 10/29, Sales rose 9 percent to $22.03 billion however they dropped the low end of their earnings guidance due to commodity and foreign exchange volatility (Reuters). As of today's close, for the 9/30 quarter, the P/E ratio stood at 16.82, and forward P/E at 14.98. The 5 year range is 16.6 - 24.50, so it looks decently valued, given a looming recession. However if there's a big disappointment next quarter, the stock could fall to readjust the p/e. Here is the CNBC update with a JP Morgan analyst. Couldn't embed, directs to cnbc.com.
I also provided some quotes by Clayt Daley, their CFO, during P&Gs most recent earnings call (9/30/08) where he clearly explains how commodity and foreign exchange volatility affects their top and bottom line. P&G has been increasing prices to help offset higher energy and raw material prices, and they expect to see the most recent commodity sell off benefit them in future quarters, due to a lag. I can only quote up to 400 words, the full transcript can be found at seeking alpha.
"There are three important things to understand here. First, commodity and energy markets are becoming increasingly volatile. (Oil: $119 on 8/5, $98 on 9/18, $123 on 9/27, and $65 today).
Second there is a lag between feed stock market moves and the price P&G pays for its materials and the ultimate impact of these materials on our income statement. Oil based materials flowing through our cost of goods are still increasing, tracing back to the oil run up in June and July. We actually will see most of the impact of the steep oil price run up in the June/July period in our December quarter results.
Third, P&G costs are not directly tied to oil and the spot prices of many materials are still increasing. For example, phosphate averaged less than $600 per metric ton during fiscal 2007. Last year it averaged $1,100 per metric ton and currently is close to $2,000 per metric ton…..
Now on to foreign exchange, historically we have told you that foreign exchange impacts our top line more than our bottom line and that the bottom line impacts are largely translational in nature and these are partially offset by natural hedges within the portfolio such as commodities. Now while this is still true, we have seen unprecedented volatility in the foreign exchange markets recently. Even more than in the commodity and energy markets.
I want to explain what is happening in emerging markets in more detail so you understand how we will be managing this and directionally what the impact is likely to be. To do this, let me use a hypothetical example. Let’s assume a business in a developing market has half of their purchased raw and packing materials denominated in U.S. dollars. All other costs including SG&A are denominated in local currency. Now let’s assume a 30% currency devaluation takes place relative to the U.S. dollar. Input costs that are denominated in dollars go up 30% in local currency. This is the transaction impact of the currency devaluation. Every one in the market experiences this transaction impact regardless of their functional currency.
It is effectively an increase in commodity costs which like other commodity cost increases we will plan to recover through pricing as appropriate or through formula cost savings or other cost reduction programs. When the earnings in this country are translated back into U.S. dollars they will then be worth 30% less. This is the translation impact of the currency devaluation. Translation impacts are much harder to recover through pricing.”
Even though Procter & Gamble is labeled as a safe haven during recessions, they still have exposure to consumer spending volatility due to their high end product lines, like Gillette Razors, Duracell. People may go for straight generic brands if money gets tight. And not just here, but emerging markets as well.
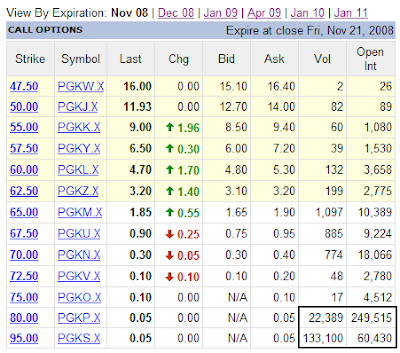
Anyway, the stock rallied after their earnings announcement. It broke out of a downtrend recently, and could see resistance at $64, and $66. So we'll see what kind of market conditions we're in. The long term trend from 2002 doesn't look that hot, it broke to the downside recently. That could give the green light to test new lows, if it's not just a short term blip. Also, I charted out the US Dollar vs. Procter & Gamble during the past 10 years since the CFO was talking about foreign exchange volatility. They look to be inversely related, however from the early 1990s-2001, P&G and the USD moved up synchronously. So probably all depends on location of earnings and exchange rates. So, the main point is, there's a move coming because big money is levering up in the options market. So watch P&G's stock, and go to stocktwits.com to see what's going on.

PG 10 Year Chart (Source: Bigcharts.com)

PG vs. $US, 10 Year Chart (Source: Barchart.com)