This blog discusses investment opportunities and analysis consisting of equities, bonds, options, commodities, futures, indexes, and other investment vehicles traded on public exchanges. It focuses mostly on data trends combining economic, industry, fundamental, valuation, technical and sentiment analysis.
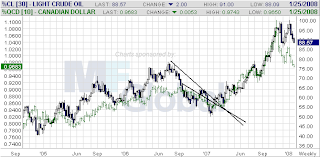
I used to be bullish on the Canadian Dollar via the $CAD/$USD trade back when it was trading around 0.82 when oil corrected to $49, and natural gas to $6 in January 2007. Canada is a huge commodity exporter and if these commodities increase in value the $CAD/$USD should get a boost (if there isn't extreme monetary inflation for some reason, localized economic/employment issues, or other risks unrelated to free market forces) because these commodities are priced in US dollars (inverse relationship) around the world so Canada could buy more dollars with their commodities, hence the $CAD/$USD would increase in value.
Canadian Income Trust Massacre of 2006
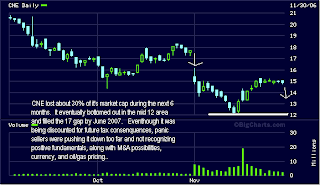
So I took the contrarian view along with other analysts that oil/natural gas was headed higher because of foreign demand, middle east tensions, deficits, US recessionary talk and the inflated US dollar. At about the same time the Canadian Government decided to tax income trusts at the corporate rate of 31.5% starting in 2011 instead of using the flow through entity trust tax structure which transfers all income to the unitholders, which the company can deduct for taxes. With this new tax rate as a corporate entity the company would have less cash on hand to distribute as dividends, plus they'd have less cash to purchase existing oil fields to stay alive. Anyway, as a result there was a "Canadian Income Trust Massacre" on the Canadian exchanges and some Canadian energy trusts lost almost 1/3 of their values and they looked very attractive because not only would these trust securities rebound if their oil/gas assets increased in value, interest income would increase to US holders as the $CAD/$USD conversion would boost the Canadian denominated interest income.
This in fact occurred, the sell off was overdone because the tax would not take effect until 2011 and the underlying commodities were bottoming out. Today the Canadian Dollar is at about parity with the US Dollar 0.98, and the CAD/USD hit a high of 1.09 in late 2007. Oil recently hit a high of $147!
The tax decision was shocking because the Prime Minister Steve Harper said they wouldn't tax these trusts, and billions of retiree money was destroyed. Eventually these trusts were bought out or merged, and Canetic Resources got taken over by Penn West Energy Trust for $16.67. If you got in at the panic $12 lows you'd have a 41% gain in a year.
Canetic Resources 2006 Chart
Canadian Dollar/Oil Relationship 2005-2008
Income Trust Massacre Videos
The Case For The Long USD/CAD Trade
Now it appears that the oil/natural gas bull is correcting. A commodity correction would bring commodity induced inflation and producer costs down, which could enable interest rate increases down the road once housing stabilizes. If the new housing recovery bill gets signed by the President to help struggling home owners it could allow Ben Bernanke to increase rates, which would boost the dollar and cause oil prices to go down. Also today, in a Dow Jones recent article, OPEC was quoted saying that Oil may drop to $70 if Iran concerns ease and the US Dollar strengthens. All of this could be the reason why oil and natural gas are correcting at extreme levels and could hold well for a long USD/CAD trade.
I've decided to look at Yahoo again. I was first interested in this company when it it broke the $20 level back in January of this year right before the Feb 1st $31 buyout offer by Microsoft.. In late April when Microsoft said they were willing to increase the bid to $33, Yahoo wanted $37 and Microsoft walked away. Then Carl Icahn came in, scooped up a bunch of shares, wanted Microsoft to buy Yahoo at $34.375 or $49.5 billion, and threatened to seek control of Yahoo's board of directors. Also remember that Microsoft bid $40 for Yahoo in January of 2007. In the past month it has hit around $20 and I think it's looking attractive again for a long term turn around or buy out.
It looks like they reported 2nd quarter earnings today and agreed to appoint Icahn and two of his nominees to the board.
Q2 Earnings Summary
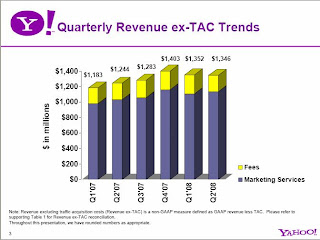
Net Revenues: $1.346 Billion +8.2% YoY
Operating Income: $101 Million -45% YoY
EBITDA: $427 Million -10% YoY
Free Cash Flow: $231 Million -30% YoY
From Alleyinsider:
Gross Revenue lower end of the guidance range: $1.78 billion vs. $1.73-$1.93 billion guidance. Net Revenue below consensus: $1.346 billion versus $1.37 billion consensus. Operating Income weak, despite mass firings: Paltry $101 million vs. $135-$155 guidance. EBITDA okay if you exclude $22 million in Microsoft advisory fees: $427 million versus $425-$455 guidance. Even after backing out Microsoft fees, still missed consensus of $450ish. Free cash flow only $231 million, down 30%. Remember when Yahoo used to gush cash? Those were the days. EPS: $0.10 vs. $0.12 consensus. Ouch. Outlook: 2008 Gross Revenue: guidance now $7.35-$7.85 billion vs $7.2-$8 billion previous ("narrowed"), 2008 EBITDA: guidance now $1.825-$1.975 vs. previous guidance of $1.775-$2.025 ("narrowed").
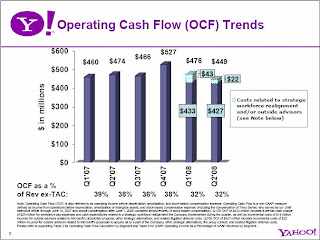
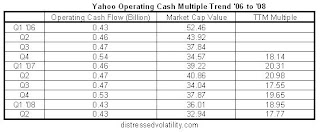
First Two charts from Yahoo Q1 '08 Presentation
EBITDA or Operating Cash Flow Multiple Trend
Obviously a great way to realize value here is through asset liquidation with all of their hidden properties with excellent growth prospects and potential bid premiums.. I'll look at EBITDA or the Operating Cash Flow multiples first. If you were to put on the highest TTM EBITDA multiple of 21 (Q2 '07) during the last 10 quarters, you'd have a $28.50 share price based on this historical comparable. Add to that the future $250-$450 million in incremental operation cash flow that could be generated from the Google Search Advertising Deal, at the minimum $250 additional cash flow, it would fetch $32.30. So Microsoft does have some leverage with the $33 number, however the $450 million of additional cash flow would net a $35.31 value, even higher than what Icahn wants.
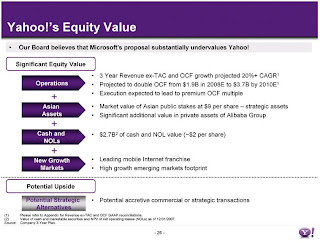
In this chart from the March 2008 presentation, Yahoo believes Microsofts bid significantly undervalues the company based on it's: Projection to double OCF growth by 2010 (from $1.9 billion to $3.7 billion), it's market value of asian assets, cash value per share, and it's opportunities in new growth markets.
March 2008 Presentation
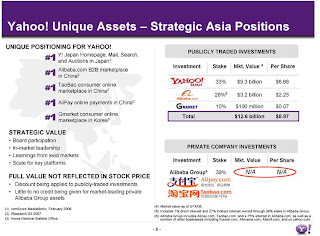
From the March 2008 presentation, Yahoo valued it's publicly traded Asian assets (Yahoo Japan, Alibaba.com, Gmarket) at $12.6 Billion or about $9 a share. Also, Yahoo owns a 39% private investment of Alibaba Group which owns various entities including TaoBao, Koubei, Alipay as well as an interest in Alibaba.com which was already calculated in the alibaba.com allocation previously.
On the most recent conference call, however, Yahoo said it's publicly traded Asian assets were worth $10 Billion or $7, but it did not include the privately held entities owned by Alibaba Group. The decline is most likely related to the big sell off in the Asian markets during the past 3 months.
"Our cash and marketable securities balance was $3.22 billion at the end of the quarter, up over $370 million from the prior quarter. At the end of the quarter, the value of our direct and indirect interests in the publicly traded securities of Yahoo! Japan, Alibaba.com, and Gmarket, were valued at approximately $10 billion in the public markets, or over $7 per share. These figures include the value of the shares of Alibaba.com held by Alibaba Group, of which we own approximately 40%. These figures do not include estimates of the value of Alibaba Group’s other privately held businesses, such as [Talbow] and Alipay, which we believe provide significant additional value."
This values the Asian assets plus cash at around $9.35/share excluding the additional value from privately held entities of the Alibaba Group. I found various asset valuations during the past 9 months.
"On May 1, 2008, Piper Jaffray issued a research report this morning offering its take on the value of Yahoo!'s (Nasdaq: YHOO) foreign investments. The firm has a Neutral rating and $31 price target on shares of Yahoo!. As Yahoo! has said that Microsoft (Nasdaq: MSFT) is not fairly valuing the company's stock in its attempt to buyout Yahoo!, shareholders are speculating about the worth of several of Yahoo!'s foreign investments, which could turn out to be very beneficial.
Piper calls Yahoo!'s largest foreign investment, Alibaba Group, "one of the best positioned Chinese Internet companies". The firm values Yahoo!'s 39% stake in Alibaba at about $4-$5 per share. Additionally, Piper values Yahoo!'s 33% equity stake in Yahoo! Japan as worth about $6.46 per share, its 10% stake in Gmarket (Nasdaq: GMKT) as worth about $0.08 per share, and finally its 1% ownership in Alibaba.com as worth about $0.07 per share. Adding to these investments, Yahoo! had about $4.15 per share in cash at the end of its March quarter. Bringing this all together, Piper sees Yahoo! as holding at least $13.12 per share in foreign investments and cash alone." Source
Other analysts believe it is worth more if their search business was outsourced to google, cutting 25% of their staff and restructuring their main display advertising division.
"On October 5, 2007, Jeffrey Lindsay, analyst at Sanford C. Bernstein, said Yahoo's operations viewed separately could be valued as high as $39 per share, compared with a current share price closer to $27 if it broke up its Internet businesses or embarked on a major overhaul, including a departure from Web search, but management is unlikely to do either, according to an analyst note issued on Friday.
The company, which lags Web search leader Google Inc and faces greater competition for its e-mail services, could be worth as much $45 per share with a dramatic overhaul that would include outsourcing its paid search, cutting staff by 25 percent and restructuring its graphic display advertising, according to Lindsay. Yahoo's main display advertising business appears to have deteriorated, mainly due to the company's troubles in effectively capitalizing on its ad network, Lindsay said. He reiterated a "market perform" rating on the stock, with a $25 price target." Source
With all of this said, it looks like there's a true value range between $30 - $40 based on future cash flow multiples, asset values, as well as Microsoft's public bid of $33. However, especially in this earnings environment, it's hard to pin point an exact realized value using these valuation methods.
First of all, how about this market? The Government comes in and saves Fannie Mae and Freddie Mac and also seizes IndyMac Bancorp Inc after a bank run (Fed offers to lend to mortgage companies, Treasury plans possible equity investment. IndyMac seized as financial troubles spread). I don't know if I should be surprised that the VIX ISN'T at all time highs and indices at all time lows. Actually right now, a little bit later in the day, the VIX is hitting highs on the day and the major averages and banks are dying again.. Listening to CNBC news alerts about possible bank runs is actually reminding me of books I read about the great depression, scary.
Now looking at General Motors. This chart basically explains everything! The Inverse correlation between GM and OIL (USO in this case).
It's to no surprise right now that GM's gas guzzling vehicle sales are declining in the US due rising gas prices and a struggling economy, however I should note that GM sales rise in Latin America, Africa, Mideast. But today is different than 2006 when GM's stock was under 20 and bonds were at lows, people thought it was a buying opportunity. Well for a while it was, until now when it just hit it's 52 year low. It just broke $10 and is currently at $9.27. Bankruptcy talk is now hitting the headlines by big investment banks, and volatility is very high.
GM Falls to Lowest Since 1974 on Goldman Rating Cut (Update4) Bloomberg, GM Bankruptcy `Not Impossible,' Merrill Analyst Says (Update4) Bloomberg, Investors see higher risk of GM default Reuters.
If I were to take a contrarian view at this moment I think I'd stay away from the common, and look more toward the debt. If GM has a stock offering to raise capital during their restructuring process there would be huge dilution. I believe this news is in process of being priced into the stock but there's too much of a risk that the price could go lower than higher before, I hope, an eventual rebound. However GM could also raise capital in other ways like selling off poor performing brands and getting into the more profitable smaller car/gas efficient space. Eventually oil will come down and housing will bottom in years to come so GM could be a great turn around story if they have liquidity to survive.
The $7 target Merrill put on GM is already implanted into traders minds and could touch that level before traders buy the news. It does seem we are near the point where you could see an eventual top in fear because of the horrible sentiment of bankruptcy and implied volatility is at all time highs and is spiking higher than the historical volatility which means something is going to happen very soon. Once the news is out, and it's a decent restructuring, volatility will be sold hard and we could see a nice rally in the debt and equity. This Implied Volatility chart is supplied by OptionsXpress.
GM Implied Volatility vs. Price
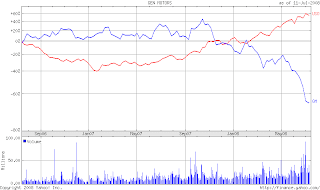
I chose to look at the GM exchange traded notes (debt that trades on the exchanges like a stock), they have been sold off just like the stock, and they're trading lower than they're previous '06 lows. The ETNs look like a better risk/reward right now (if they don't go bankrupt of course) than the common as you get paid north of 15% while you wait for a rebound, and you could possibly dip into the common at a cheaper price.
The GENERAL MOTORS 7.5 SENIOR NOTES(GMS) yield 15.5%, the GENERAL MOTORS 7.375 SENIOR NOTES (HGM) yield 15.9%, and the GENERAL MOTORS 7.25 SENIOR NOTES (XGM) yield 15.6%. Charts by Bigcharts.com.
As you've read in the news, Detroit's current mayor Kwame Kilpatrick is currently being investigated in a text message scandal and now I recently read this article by AP: FBI Probe Latest Setback for Beleaguered Detroit. FBI probe of sludge recycling contract is latest setback for beleaguered Detroit..
"Auto industry cutbacks, double-digit unemployment and one of the nation's highest home foreclosure rates have left Detroit with a dreary economic future. Now, a mayoral text-messaging sex scandal, federal investigation into a City Council-approved $47 million sludge recycling deal, and poorly run and deficit-plagued public school system have dashed inroads toward respect and reopened Detroit to outside ridicule. "When we're out doing business and trying to get customers we sometimes get asked 'You're from Detroit? What's going on there?'" Compuware Corp. senior vice president Jason Vines said. "As taxpayers and residents, it has to be disheartening. When your city is used as a public joke, it's not good." Like most major cities, Detroit is no stranger to scandal. Former City Council members, and even a police chief, have been indicted, arrested or imprisoned. But the current political crisis threatens to bury the city deeper in an economic grave. While the mayoral text-messaging scandal has been going on since the end of January, the past week alone has brought a new round of bad news for the city."
So I read this, and then I read this a few days later!!
Dave Bing: I may run for mayor of Detroit. Scandal drags city down, he says.
"Detroit businessman and former NBA star Dave Bing is considering a run for the Detroit mayor's office because the city needs to "regain credibility" after the scandals that have infected all levels of government, and before the city loses the middle- and working-class population so necessary for its renaissance. "I don't think most of us that live in Detroit or call Detroit home feel real good about it right now and that's so unfortunate because there are so many good things happening right now," said Bing, the 64-year-old founder and president of the Bing Group, an automotive supply company and a real estate developer whose latest project is a condo development on the city's waterfront. "All of this overshadows that. We've got to get back on track to turn this ship around, and I think it will be with new leadership."
I think that will be a helpful start for a Detroit turn around tied to the dying auto industry. Detroit is at a 100 year low, it peaked when Henry Ford came out with the Model-T. With Dave Bing, and help from: (1) Dan Gilbert founder of Quicken Loans, owner of CAVS, and newly formed private equity firm RockBridge Equity Partners (Gilbert starts private-equity biz, RockBridge to invest up to $200M, focus on Michigan) who also plans on moving the Quicken Loans headquarters downtown (Quicken Loans Headquarters Will Bring 4,000 Staff to Downtown Detroit in a Joint Announcement with Mayor Kwame Kilpatrick), (2) an online interactive promotions start up called ePrize, and (3) some interesting bank/private equity start ups in the Detroit area that have big asset bases together all have potential to grease up the economic engine for new potential businesses in need of capital and people in need of jobs. So Detroit is starting to get the point that they need to diversify out of the auto industry. Plus don't forget Detroit has 4 professional sports teams!!!
Also, it's great to hear talks about the funding of a light rail transit system in Detroit. Detroit needs a safe public transportation system in order to attract a thriving social community, which will eventually drive business back to the city. Michigan Bill Would Allow TIFs for Transit (bondbuyer), Legislators, Gilbert, Penske will back light rail on Woodward (Crains), Hertel at Mackinac: Mass transit could drive economic turnaround in Metro Detroit.
Can mass transit really happen in Detroit?
I'M NOT SAYING THINGS ARE LOOKING BRIGHT! Detroit is dealing with huge unemployment issues, a horrible housing downturn, the distressed auto industry situation, oil prices affecting drivers, and business trickle down effects all throughout the area killing business. Michigan jobless rate jumps in May, Metro Detroit home prices continue downward spiral
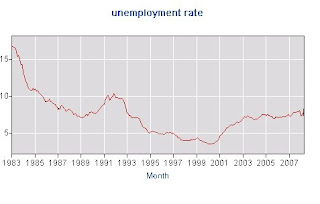
"DETROIT (Reuters) - Michigan's unemployment rate jumped to 8.5 percent for May, the highest jobless rate in 16 years for a state that has been hardest hit by the combined downturn in the U.S. auto industry and the slump in housing. The Michigan unemployment rate, up from 6.9 percent in April, was three percentage points higher than the national rate of 5.5 percent for the month."
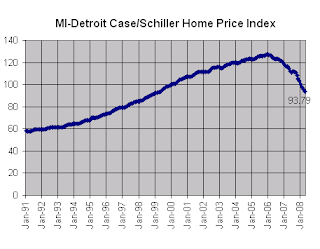
"In April, metro Detroit saw home prices drop by 18% compared to the same month a year ago. Prices fell 1.9% since March. Metro Detroit remains the only metro area in the top 20 that has an index level under 100. Metro Detroit had a 93.79 index level in April, below the 100 set in 2000 as the baseline. That means home prices have not risen enough since 2000 to offset the current erosion. Detroit’s home prices have fallen off more than other Midwest cities. Cleveland had an index level of 109.55 in April, Minneapolis was at 139.19 and Chicago was at 150.44."
Detroit Unemployment Rate (bls.gov)
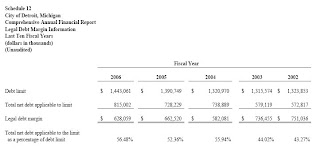
So, now I'd like to actually check out some of Detroit's financial statements. It looks from there website that they only have their fiscal year ending June 30, 2006 comprehensive annual report, and haven't we passed June 30, 2008? That's a big reason why Moody's just downgraded their bonds on May 30, 2008 because they didn't have up to date numbers, as well as had a declining general fund balance and current economic hard ships. Also, if you care, look at this most recent July 1, 2008 article in the bond buyer, It's Never Dull in Detroit. Now I thought I'd look at Detroit's numbers from 2006, so in no way is this relevant to Detroit's current situation, it's very backward looking.
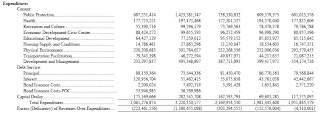
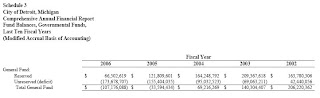
The pictures I'm going to show you were from the 2006 CAFR which can be downloaded here. So I took a peak at the 2006 statements, and REMEMBER folks this is at the PEAK OF THE HOUSING MARKET! I found a historical trend section in the back and it looked like their total governmental fund revenues were relatively stable, however in order to probably substitute for their increased debt service costs that almost tripled they cut some expenditures across the board. Looking at their most important fund, the general fund balance, I saw that it was at -107 million compared to 206 million in 2002, that is a HUGE DEFICIT! They transferred 139 million to the transportation fund and debt service fund for principal and interest payments. Also, looking at their property tax base valuation chart, the residential valuation went from $4.6 billion in 2003 to $5.46 billion in 2006, I couldn't even imagine how they would value the property in 2008, post housing bubble with property tax revaluations due to foreclosures. That would ultimately effect their legal debt limit (which is specific % of assessed value). Their legal debt margin stood at $628 million with a debt limit of $1.4 billion or 56.48% in 2006. The percentage has been rising since 2002, but there were even higher levels in 1997 and 1998.
Total Fund Expenditure Trends
General Fund Balance Trends
General Fund Balance (Transfers Out)
Assessed Property Value Trends
Legal Debt Margin
Eventually the municipal bond debt will start to look attractive when the price reflects more distressed levels of Detroit and Michigan in general. I would like to see Detroit's 2007 and 2008 audits first, with the auto industry laying off so many people tax money is leaving in droves. Here are some long term charts of closed ended Michigan Municpal Bond ETFs. BlackRock MuniYield Michigan Insured Fund, Inc. (MIY) with a price/book value of 0.83, and the Nuveen Michigan Quality Income Municipal Fund Inc. (NUM) with a price/book value of 0.84.
I'll leave you with some optimism, here's an article in the press saying it's a great time to buy real estate in the Detroit area, and it only comes every 25 years.
Oil sets new record above $147 a barrel: Crude jumps above $147 as concerns persist about Middle East conflict; heating oil hits record.Link
I found this argument on CNBC between some smart traders that caught my eye this morning. Rick Santelli knows whats going on.. Economic Panel: Oil soars to a record near $147, with Jack Bouroudjian, Brewer Investment Group; Mad Money host Jim Cramer and CNBC's Rick Santelli. CNBC Video Link
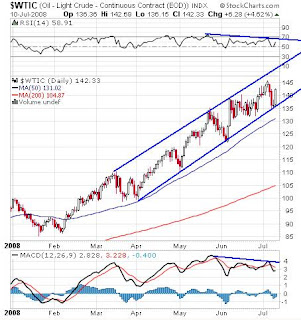
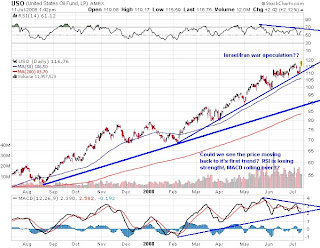
I'm going to look at the Light Sweet Crude Contract, USO, XLE, Charts and Option Activity.
Light Sweet Crude Chart Analysis
USO Chart Analysis
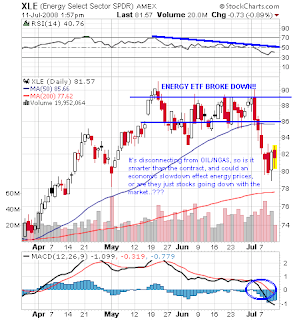
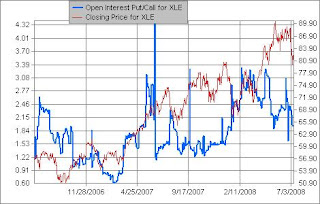
XLE Chart Analysis
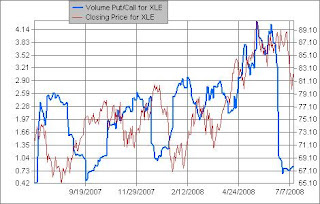
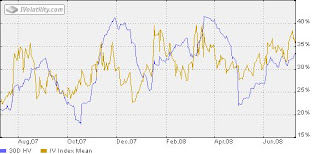
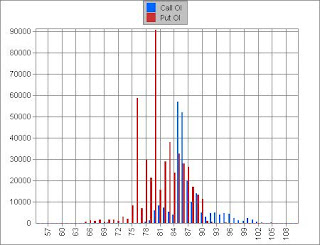
The next charts I've enclosed are the Implied Volatility Index Mean vs. Historical 30 Day Volatility and Put/Call Volume Ratios vs. Stock Price. It seems that the XLE I-Volatility is pretty much at the 30 day historical level, and they've moved up . You can see that historical volatility rallied hard when crude oil went from $110 in May to $145. It seems there are huge disconnects between the XLE and current oil contracts. Today its Implied Volatility is at 36% and historical is at 33%, close to year highs but complacent. The last two times volatility hit around 40 it was during deep XLE corrections and volatility was expensive and sold. Implied Volatility had the pattern of bottoming out in the 20s and topping out the stock. Could implied volatility break out to new highs extending corrections? Today Oil rallied to $147 based on middle east feuds, however the XLE is currently down a few percentage points. It's odd, but maybe the stocks are factoring in business and systemic risk factors. If the middle east feud simmers down and there is demand destruction, it could bring oil back to $100 in the next 2 years like T. Boone Pickens suggested and XLE Implied Volatility could break out positioning XLE for a long term trade to the downside. Also you can see that the Put/Call Volume Ratio decreased dramatically recently while XLE was topping out before the stock plunged 11% in July, but short interest in the beginning of July increased 16.75% to 72 million from 62 million in mid June. Also, the Put/Call Open Interest Ratio trend looks to be falling but put sentiment is still about 2x calls and could spike at any moment.
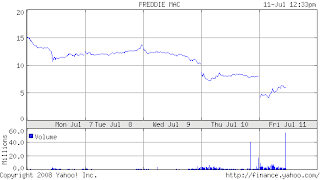
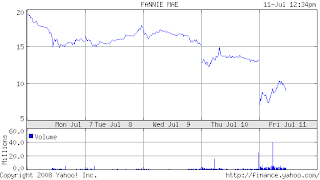
Wow, the market just KEEPS getting killed. Credit crisis is alive and well! Freddie and Fannie are hitting new all time lows. Lehman was down 20% today hitting an intraday low of $13.29 (Shares Of Lehman Brothers Sink Amid Financial Sector Concerns).
Also there are Bloomberg headlines that the gov will NOT bail out Fannie and Freddie! “Our primary focus is supporting Fannie Mae and Freddie Mac in their current form,” Mr. Paulson said in a statement. “We are maintaining a dialogue with regulators and with the companies.” Fannie and Freddie Shares Fall by as Much as 50 Percent. Look at these 5 day Fannie Mae and Freddie Mac charts from Yahoo Finance, it looks like there has been some big volume blocks, is this overdone? Well there's still a lot of put volume at the Fannie Mae July 7.50 puts (Volume 14,313 w/3,317 OI) and 5.00 puts (Volume 18,440 w/3,632 OI). Is volatility at its peak here?? UHHHH.. WE'LL SEE!
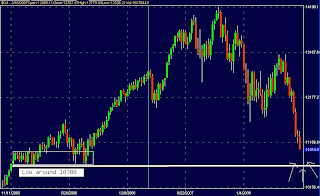
As of now the Dow is at 11,029!!! It pierced through 11,000 and hit 10,980. I think we're going back to the 10Ks folks! The Dow is at lows not seen since 2006! I'd say we're in a bear market, but from the look at the long term chart on the dow we could see support at the July 2006 lows of around 10,700. There are some big bargains, well hopefully soon bargains, of some BIG AMERICAN COMPANIES right now folks!
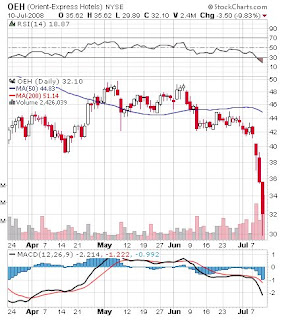
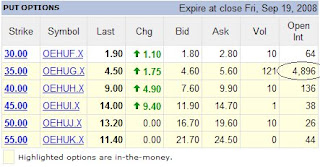
Orient Express Hotels is interesting, and I've been watching this for about six months now. Here we have an amazing company, seriously look at the assets at their website. Anyway, late 2007 a bunch of institutions (including DESHAW,SAC) were scooping up >5% positions in this company, and also Indian Hotels bought about 11.5% of the company in a December 2007 filing and Indian Hotels wanted to do a partnership with Orient Express but Orient refused. Anyway, this seekingalpha post I read a while back got it spot on. It was overvalued relative to earnings and book and the current economic crisis is not helping. I read recently they were planning on doing joint ventures with this real estate developer called The Related Group "a premier real estate developer in the United States, initially to develop hotels and residences in South Beach Miami; Cartagena, Colombia; and Panama City, Panama." Anyway, as I'm reading all of this I see thousands of Sep $35 put contracts trade which was way over the open interest and average option volume. The stock was around $38 at that time, and the stock tanked today (a few days later) to an intraday low of $29.89 on 4x average volume. Eventually this stock will be a value play.
Welcome to distressed volatility. I got the first name by thinking of certain situations that some large cap companies are in at the moment "distressed" as well as why the some stocks that define America (GM) are being pushed down to 52 year lows "volatility". So there you have it, Distressed Volatility. I look forward to discussing anything I come up with during my daily analysis routines of the stock market as well as news and information via the internet and bloomberg tv/cnbc/foxbiz. I like to look at charts and volatility to distinguish where the action is as well as where it could be headed. I also like ratios, financial statements and options so I'm going everywhere when needed. I'm also a fan of zen Japanese tea shops.
This blog is for personal enrichment and informational purposes only. The information presented on this blog should not be used as advice to buy or sell securities and will not be held responsible for investment decisions made, or liable for losses incurred. The investments discussed on this blog may not be suitable for all investors and investors must make their own investment decisions based on their own investment objectives. There is no guarantee that anything discussed here, or data mentioned, is accurate, my blog entries are my personal opinion along with information used from various sources. These sources will not be held responsible for anything mentioned on this blog. Please contact your personal financial advisor for professional financial matters or subscribe to professional data services for your financial data needs. Please email me with any questions or concerns.