This blog discusses investment opportunities and analysis consisting of equities, bonds, options, commodities, futures, indexes, and other investment vehicles traded on public exchanges. It focuses mostly on data trends combining economic, industry, fundamental, valuation, technical and sentiment analysis.
I knew there were treasury interest rate swaps, but treasury credit default swaps? You've heard in the news that credit default swap spreads (ability to swap defaulted debt securities w/ a counterparty at par) have been spiking due to the large amount of banks going under. The interest rate spread, or swap spread priced in basis points, is the cost of protecting the debt from default. The swap spread increases as the default risk of the underlying security increases. There are U.S Treasury Default Swaps quoted in euros. You can find real time data at CMA DataVision or the Bloomberg Professional service for a fee. With the thought of almost a $trillion in government bail out money passing congress, it looks like people are starting to bid up U.S Treasury Default Swaps due to the current state of the U.S balance sheet. Here is a chart sourced from the article "A default by the US government is no longer unthinkable" from telegraph.co.uk on 9/20/2008. The chart is no long available with that article, but I found it somewhere else. Also Treasury CDS spreads hit a new record 4 days later (9/24/2008 Reuters article below).
"US 10-year Treasury CDS widens to record 29.2 bps-CMA
Wed Sep 24, 2008 6:28am EDT
LONDON, Sept 24 (Reuters) - The cost of insuring 10-year U.S. government debt against default rose to a record high on Wednesday as investors fretted over the feasibility of the government's $700 billion plan to contain the financial crisis. Credit default swaps on 10-year Treasury debt expanded to 29.2 basis points -- its widest ever -- from 26.5 basis points on Tuesday, according to CMA, a specialised data provider. CMA said CDS on five-year widened to 22.0 basis points from 20.5 basis points. (Reporting by Emelia Sithole-Matarise)"
Credit ratings agencies, like Moody's and S&P, also have an effect on the pricing of risk, or swap spreads in this case. When they lower the rating on an entities debt, interest rates rise as investors demand higher payments for the extra risk. Recently Moody's and S&P have thought about lowering the AAA rating on U.S government debt possibly in the next 10 years if they keep piling on trillions of debt. That's what is happening here, swap spreads are widening because risk is being repriced appropriately.
"S&P says pressure building on U.S. "AAA" rating
Wed Sep 17, 2008 5:29pm EDT
NEW YORK (Reuters) - Pressure is building on the pristine "AAA" rating of the United States after a federal bailout of American International Group Inc, the chairman of Standard & Poor's sovereign ratings committee said on Wednesday. The $85 billion bailout of AIG on Tuesday by the U.S. Federal Reserve "has weakened the fiscal profile of the United States," S&P's John Chambers told Reuters in an interview. "Lack of a pro-active stance could have resulted in further financial stress and put pressure on the U.S. triple-A rating," Chambers said. "There's no God-given gift of a 'AAA' rating, and the U.S. has to earn it like everyone else." The cost of insuring 10-year U.S. Treasury debt against default rose on Wednesday to a record high, a day after the government rescued insurer AIG with an $85 billion loan. At one time, AIG was the world's largest insurer, ranked by market value. At midday on Wednesday, AIG's stock was down 33 percent at $2.50 on the New York Stock Exchange. Ten-year credit default swaps, or CDS, on Treasury debt widened 3 basis points to 26 basis points, according to data from CMA DataVision. This means it costs $26,000 per year to insure $10 million of U.S. Treasury debt against default. Five-year credit default swaps on Treasury debt were steady at 21.5 basis points. That compares to 9.8 basis points on German 5-year CDS and 13.2 basis points on German 10-year CDS, CMA said. Earlier this month, S&P affirmed the "AAA" sovereign rating of the United States, noting risks to the U.S. credit profile, including the deteriorating credit profiles for most U.S. financial institutions over the past 12 months, S&P said in a September 3 statement........click for more article."
I just saw the movie I.O.U.S.A, where the film follows former U.S. Comptroller General David Walker as he travels the country explaining America's unsustainable fiscal policies. With the US Gov now proposing a $trillion bail out, it shows how serious this problem is. I have to say I'd rather be writing about stocks, but I think this issue needs to be addressed for the future health of our market, especially if there is a serious crisis. This will probably be the most depressing post and hopefully a sign of a market bottom. Here is the movie trailer and an interview with David Walker on Lou Dobbs.
I.O.U.S.A Movie Trailer
Lou Dobbs: David Walker On USA Debt 09/20/08
Our country is now a sub-prime credit on the earths balance sheet. I'm going to present major points of the movie which consisted of the total public debt and fiscal deficit, trade deficit, foreign treasury ownership, historical savings percentage and household debt to GDP ratio. I will look at the current state of the U.S Dollar and treasury swap spreads in the next post.
First I'm going to show this artistic historical chart of the annual increase in national debt. It is interesting that Clinton was close to paying down the national debt, while the Reagan and Bush administrations were out of control. Of course both Bush's spent lots of money on wars (Gulf War and Iraq, and of course there are heated debates on the actual net worth of that spending, and who knows how much Al Gore would've spent finding Bin Laden in Afghanistan after 9/11), but here's an article from CNN, on May 1, 2000, about Bill Clinton's success.
Clinton announces record payment on national debt
"WASHINGTON (CNN) - President Bill Clinton said Monday that the United States would pay off $216 billion in debt this year, bringing to $355 billion the amount of the nation's debt paid down in the three years since the government balanced the budget and began running surpluses. In a written statement, Clinton said the $216 billion payment represented the largest debt paydown in American history, and he said that the federal government's long-term debt is now $2.4 trillion lower than projected to be when he first took office. However, the U.S. government still has a long way to go before it pays down the entire national debt, which now stands at $5.7 trillion. Clinton also used the announcement to take issue with Republican tax cut plans, noting that "the debt quadrupled in the twelve years before I came into office," a reference to his Republican predecessors, Ronald Reagan and George Bush."
Fiscal Deficit Trend (St. Louis Fed)
First let's look at the Total Public Debt from data used by the St. Louis Fed (FRED Database). As of 6/30/2008 total debt stood at $9.49 Trillion. Of that $9.49 Trillion, $5.28 Trillion was held by the public (savings bonds/treasury debt held by individuals and entities excluding the US Gov). Of that $5.28 Trillion, $2.64 Trillion was held by foreign and institutional investors. The total national debt increased by 67%, or $3.8 Trillion from 6/30/2000 to 6/30/2008. Every year deficits add to the total debt. An important note from the movie mentioned that if we continue to add to our existing debt, the Gov will not be able to afford social security and health care benefits down the road. Here is the chart.
What is also alarming is the Foreign Holders/Total Debt Held By Public ratio. It now stands at 50%. Foreign countries have been using dollar denominated income derived from our imports to finance our country. That is a big deal because if we can't service the debt, or foreign owners want to diversify out of the US Dollar or sell treasuries in the open market to raise cash, who will support the treasury market or take the other side of the trade without using the printing press?? Do the American people have enough savings to buy up Liberty Bonds like WWI? Since these foreigners own debt guaranteed by the Government, if we can't pay them back will they be entitled to ownership of our assets in a liquidation or reorganization?! That's what happens in a bankruptcy right? That would be interesting. Also I don't think the trillions of hedge fund money and billionaires would be the white knights in this situation. The Government would just inflate the money supply which would create massive inflation, a run on the dollar, a big tax hike and an end to many entitlement programs. Comparing this situation to the proposed financial bailouts we're experiencing today, our Government would have to bail out our Government. I'm sure these foreign nations wouldn't dump all their treasuries at one time because they do have an indirect interest in our country's prosperity, that's if we continue to import their goods, provide a valuable export, and have a good relationship... Either way, as a person in the movie said, we won't wake up until we're in a crisis.
Next, the movie talked about the our savings rate trend and our trade deficit. American's do not save anymore and we continue to import more than we export. However, what is interesting is that the savings rate actually increased dramatically in the past 3 months of this year (2008) showing people were getting nervous about their financial situation. With loose lending over the years, we've seen that people would rather buy a house with nothing down, lever it up, and consume goods rather than save for a rainy day. Of course these people used their leverage and income to buy imported goods at cheap prices based on cheap overseas labor and currency intervention, which is probably the main reason why foreign governments have been financing us. The movie had an example of a scrap metal company. It's a cycle, the owner of the company said all he does is gather steel scraps/old cars here in the States and ships it to China & India who in turn produce the actual products that are imported by the U.S and other countries! The question I have is what if we lose our capacity to afford those imported goods or these trade flows stop being profitable for both the domestic (U.S) and foreign entities. How would this affect the foreign buyers of our financial assets? Here are stories by Jim Jubak that explain situations (mainly currency/trade inflation effects) that could change trade flows and indirectly affect US consumer prices. Basically the movie I.O.U.S.A (Warren Buffett) was saying that there could be problems down the road if we keep consuming more than we produce.
1. Our biggest export: Inflation by Jim Jubak (10/27/2007)
2. China's newest export: Inflation by Jim Jubak (5/20/2008)
I want to also include a chart of the Household Debt/GDP Ratio trend. As of April, 2008 it stood at 98%, and 10 years ago it was at 62%, which is a dramatic increase. Is household net worth overinflated due to mortgage debt that's worth more than the underlying asset? Is our GDP being supported by debt?? Being at about parity, the Housing Debt/GDP Ratio could create a risky situation if the consumer has a problem servicing its debt or defaults, and eventually the ratio spread would have to widen, or come down together. There will be a tipping point with the overinflated household which could eventually lower the country's domestic consumption and production because once the household starts to crack, employment, income, spending, production and deflation follows suit, as well as the demand for imported goods. And if imports decline, there will be less demand for our financial exports (dollar) that finances our imports which could create a change in interest rates, currency values, asset prices and trade flows all around the world. It's a crazy never ending global fibonacci spiral of economic supply and demand adjustments. Either way, something will have to happen and I'm sure all economists have different views. The question I have is, will there be a smooth transition if a crisis mounts, or will a lag affect create more economic problems.
U.S Trade Balance (St. Louis Fed)
Here is a video of Peter Schiff vs. Steve Forbes on Fox Business News. Peter Schiff has been very bearish on the U.S economy mainly due to our fiscal and monetary policies for some time now. Here is also footage of Peter Schiff in 2002.
Peter Schiff Vs. Steve Forbes (Fox Business)
Moody's Thinks About Lowering U.S Debt Rating
I wanted to point out that I saw a large amount of out of the money GM calls traded yesterday (9/25/08) at the OCT $15, and NOV $15 Strike. The stock closed at $10.03 that day. I mentioned this on Twitter last night when I checked the option chain and wanted to know if these were in fact buy to open orders.. I use Twitter to provide quick observations of trading activity, links or news headlines.. The most recent updates are posted on the right side of my blog.
"Hmm, lots of GM out of the money calls traded today. 14,689 Oct 15 Calls (19,989Open), 5,517 Nov 15 Calls (694Open).. Need OI tomorrow" (http://twitter.com/dvolatility)
Well it looks like these call options were bought to open. The OCT $15 Call open interest increased 60% to 31,936, and the NOV $15 Call open interest increased 746% to 5,180! If this is a speculative player they are definitely betting that the $25 billion loan from the Government will pass, and it is possible it could be passed this weekend (probably with the mortgage bail out talks).
"WASHINGTON (Dow Jones)--U.S. auto makers may not have access to a proposed $25 billion loan package for at least 18 months, Bush administration officials said, setting up a potential clash with congressional lawmakers. The loan package to help companies meet stricter fuel-economy standards was passed by the U.S. House on Wednesday and is expected to be passed by the Senate as soon as Saturday. The White House is expected to sign the bill." WSJ
There are still option players looking at the potential downside. Puts are active today as the stock is down .18 to $9.85. So we'll see how the options market reacts to the decision.
With all of this bail out news on Wall Street, I'm wondering how all of it affects the consumer. Will the consumer remain strong during this financial crisis? All of this mortgage bailout talk did not include consumer debt until now. I just read in Bloomberg tonight that "U.S. Treasury Widens Scope of Plan to Buy Bad Debt" (Bloomberg)
"The change suggests the inclusion of instruments such as car and student loans, credit-card debt and any other troubled asset. That may force an eventual increase in the size of the package as Democrats and Republicans in Congress negotiate the final legislation with the Bush administration, analysts said."
As with mortgages, loose lending standards were also applied to credit card debt, lines of credit, auto loans and education loans. It's interesting that the Fed's consumer debt/disposable income ratio hasn't really run out of control, but there is a trend of rising delinquencies and charge-offs at banks holding these consumer credits. With less jobs being created and unemployment rising this could definitely create more write downs in the banking sector, which is probably why the Government included them in the bailout. Plus consumer debt is securitized just like mortgages, and look what happened to Citigroup last quarter, Citi loses $176m on credit-card securitizations. "Citigroup Chief Financial Officer Gary Crittenden said North American credit card losses could exceed historical peaks, and consumer credit costs might have a "meaningful" impact on results for the rest of the year". Also as you can see from the charts below, real personal income has been falling due to inflation, mainly because high gas prices and food costs have squeezed the consumer. So again, from here it all depends on how resilient the consumer is and how fast these banks get repaired when determining the fate of the economy going forward.
It looks like the Government is listening to Bill Gross, the manager of the biggest bond fund in the nation ($50 Billion Pimco Total Return Fund PTTAX). He stated earlier in his September investment outlook that there needs to be a new balance sheet to put an underlying bid in the market, where some assets and debt securities are undergoing forced liquidations. There also might be a chance that Bill Gross gets to manage the new balance sheet.
"to ultimately stop this asset/debt deflation, a fresh and substantial new source of buying power is required. This became all too obvious as the Treasury’s attempt to entice additional capital into Freddie and Fannie came up empty. Yet this same dilemma is and will continue to confront all highly levered institutions in the throes of asset liquidation. Without a new balance sheet, their only resort is to sell assets, which in many cases leads to further price declines, or ultimately debt liquidation/default." -Bill Gross
The Bloomberg Edge: Bill Gross Sees "Financial Tsunami"
Treasury Secretary Henry Paulson, Meet The Press Pt. 1
Treasury Secretary Henry Paulson, Meet The Press Pt. 2
"The Bush administration on Saturday formally proposed a vast bailout of financial institutions in the United States, requesting unfettered authority for the Treasury Department to buy up to $700 billion in distressed mortgage-related assets from the private firms. NYTimes"
Now I want to show how billion dollar hedge fund manager William Ackman thought he could save Fannie Mae and Freddie Mac with a pre-packaged bankruptcy WITHOUT risking taxpayers money. The Treasury actually did use taxpayers money to buy up senior preferred stock with warrants (for up to 80% of common stock) that actually exposes the taxpayer to future upside in the American housing market. So if the upside outweighs the inflation risk, the temporary cost could work out very well for the tax payer.
"Because the GSEs are in conservatorship, they will no longer be managed with a strategy to maximize common shareholder returns, a strategy which historically encouraged risk-taking. The Preferred Stock Purchase Agreements minimize current cash outlays, and give taxpayers a large stake in the future value of these entities. In the end, the ultimate cost to the taxpayer will depend on the business results of the GSEs going forward. To that end, the steps we have taken to support the GSE debt and to support the mortgage market will together improve the housing market, the US economy and the GSEs' business outlook." Treasury.gov
Of course Bill Ackman was openly short the securities he thought should be wiped out or reorganized. He came on CNBC and explained his detailed strategy not too long before Fannie and Freddie was nationalized by the US Government and the common equity went to 40 cents.
Will this new Government balance sheet save our economy? I'd like to see the treasury's analysis of the after affects of this huge Government intervention. It probably all depends on how quickly the bailout repairs bank balance sheets. With the Government making the market in toxic mortgage debt it will ease forced liquidations which has been pushing down prices, like Bill Gross said. Once bank balance sheets are repaired it will ease the liquidity squeeze on the consumer allowing capital to freely flow to a new business start up or good standing home buyer, which will in turn bring employment, income and confidence to the system. So from here it really all depends on how resilient the consumer is. If there's no need for credit because of a recession it would definitely delay the recovery, and inflation could also be a concern with the Government printing out billions of new paper rectangles we call currency.
I wrote about the DXD put option open interest configuration last night when I saw there was a HUGE chunk of puts open at the 67 out of the money strike. Also overnight Dow futures were up 119 so I thought this could actually work out if it was speculative in nature. However this morning the open interest did not make sense given yesterday's volume. It looked like it could've been a buy to open error in the SEP 67 PUT Open Interest because it showed 9,527 OI on Tuesday (9/16), 77 contracts traded on Wednesday, and 760 OI on Wednesday (9/17). Open interest updates on the next day. The volume of 77 on Wednesday would not have closed out 8,767 contracts. Plus they were out of the money at the time so they would not have been exercised. There must of been blocks that should've been closed rather than opened to create such a large open interest number..I wish I saw the volume on 9/15.
Last night I posted this picture of the SEP put option chain for Tuesday (9/16) and also had the visual open interest configuration which showed the huge put block at the SEP 67 strike (at the bottom). This of course stood out as it was a huge signal for a bearish DXD trade since someone was willing to pay $952,700 to have the option to sell 952,700 shares at $67, or $63.8 Million, if it was in the money. The crazy part of it is the option was actually IN THE MONEY TODAY! The DXD closed today at $65.50 down 7.25%! So did anyone end up getting paid here?
Chart Source: Yahoo Finance 9/17/08
Chart Source: Yahoo Finance 9/18/08
Chart Source: Schaeffers Research
Obviously there was some kind of trading error at the options exchange, but these are important market signals and should be right. By the way if you want to learn about this read McMillan on Options by Lawrence McMillan.
Wow all of the banks are scrambling to merge to save themselves from this disaster!. This is even happening in the UK (Lloyds to buy HBOS in $50 billion deal). During the past few days I saw that HBOS Plc. lost about half its value at a point.
Traders bid up volatility on Morgan Stanley's options on Wednesday; sourced by the ISE Exchange, implied volatility in Morgan Stanley spiked up to 277.23%!! Today's stock price hit a low of $16.04 before getting bid up to $21.75 (-24%) at the close, which was probably due to the breaking news after the bell that there were talks between Wachovia and Morgan Stanley. It looks like the stock was initially bid up during after hours, but it's now off 75 cents to $21. The option market was very active, especially in the September 15 Puts where 55,855 contracts exchanged hands, the most out of all strikes. Call volume was also active with in- and out- of-the-money contracts losing more than 60% of their value with 47,795 contracts traded at the SEP 25 Calls, and 48,393 at the Sep 30 Calls. Calls actually outnumbered puts in the SEP month but puts more than doubled calls in October, so there are either trading strategies taking place or conflicting positions. The total put/call volume ratio still had a bearish bias at 1.43. With the most active contract, Sep 15 Puts, trading way over open interest and requiring the price to go below $13.65 to make a profit also added to the bearish bias. News about their widened CDS spreads also allowed the shorts to bring down the stock.
The cost to insure a $10 million block of Morgan Stanley debt for one year reached $2 million to $2.2 million upfront, plus the annual contract cost of $500,000, at one point Wednesday afternoon. Last week, Morgan Stanley swaps cost about $325,000 annually, with no upfront cost. Source
There were also articles regarding hedge fund clients leaving their prime brokerage..
Sept. 18 (Bloomberg) -- Morgan Stanley is losing hedge-fund clients who are concerned that a record drop in the New York- based investment bank's stock threatens its finances, investors and industry executives said. Hedge funds that account for less than 10 percent of Morgan Stanley's prime-brokerage balances this week withdrew their money or told the firm they planned to, according to a person with direct knowledge of the matter. Source
So will volatility eventually be sold and shorts squeezed due to the merger talk and the fact that Morgan Stanley has less exposure to the sub-prime disaster? Or are there bigger problems brewing within their prime-brokerage unit. We shall see what happens...
It's not great to hear the words "nationalization of AIG". Both the Dow Jones Industrials and S&P are now below the July '08 lows, at 10,690 (DJIX), and 1,172 (SPX). From the looks of the charts below, the Dow needs to hold the 10,683 support level made in summer 2006, and the S&P needs to hold the 1,150 major support level made in 2004. These 350-500 point moves to the downside are definitely putting some huge holes in the charts, and are continuing to wash out forced sellers and weak holders on both the retail and institutional side. Is the market experiencing capitulation which usually creates a bottom? It all depends if banks keep going under. Be on the look out for a huge 300-400 point move to the upside on some good news, if and when that happens. Once a strong rally occurs it will create a major support level that attracts buyers if retested, possibly creating a double bottom.
chart source: stockcharts.com
chart source: bigcharts.com
I'm wondering when the tax payers will start bailing out themselves, or consumer debt (credit cards, auto loans, school loans, plasma tv loan). If the economy slows dramatically and unemployment continues to rise, a consumer debt crisis could emerge which would hit consumer debt securities, as well commercial banks holding the debt bringing more write downs. I'm going to find some data on current consumer debt levels and compare with consumer spending, income and unemployment charts.
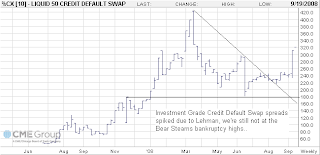
The Lehman news is definitely widening spreads in the Credit Default Swap Market. I looked at the Liquid 50 Investment Grade Credit Default Swap Index Futures chart at cbot.com. They are priced in yield spread. I never really charted these securities before but they are driving the problems of this financial disaster because all of the big banks originated swaps to protect themselves from defaults on debt securities. When a big bank like Lehman, Bear and others become insolvent and sold a CDS security to back up some debt for another firm, it might not be able to repay the principal if the debt defaults; and what if Lehman re-insured that CDS swap with Bear Stearns, well the tax payers have it now. I'm not really sure if they do that but that sounds right if it happened. It's really crazy because these banks were investing in sub-prime real estate securities and at the same time protecting other firms making these same investments! It's also crazy how the book value means nothing whatsoever on Lehman's balance sheet due to all of their toxic debt investments and other liabilities. As Lehman stands at $0.22 today on the market, they're most recent quarter book value per share was $34.88, it's nuts how nothing was marked to market until it went bankrupt! Again here is the chart of the Credit Default Swap Index from the cbot and it's an investment grade index not sub-prime. As you can see in the chart we're still not at the March '08 highs of 420bp when Bear Stearns was sold but it did break out of the June '08 highs. This index should be watched because if things get worse this index could retest the Bear Stearns highs, however if spreads start to narrow and we don't hit those old highs we could be on our way down from the peak of the credit crisis. Let's just hope enough people don't listen to Professor Roubini at NYU and create a run on the retail banks.. Then it would truly be a great depression, and not just a structured financial great depression. I think after all of this we need to bring back the gold standard. We'll see how the other big I-banks and Insurance companies come out of this...
Here's a chart of the of 2006-2 AAA asset backed securities index, or RMBS, from markit.com, which quickly turned sour as you can see. It's priced like a bond, when these indexes are first originated they are priced at par or 100, the securities in this index were downgraded since the second half of 2006 which is reflected in the current price. Hedge fund manager Henry Paulson made billions of dollars in 2007 shorting this index. The index bounced off of the 68 resistance to the downside and could be headed toward the 61 support level.
The next chart from markit.com is the 2006 CMBX AAA tranche, or AAA rated commercial mortgage backed securities index originated in 2006 priced in spreads. You can see that spreads have widened recently and broke out of a downtrend. It could retest old highs.
Well the overnight futures opened and at 8:00, according to insidefutures.com, The S&P Overnight Futures are at -36.6, and the Dow Jones Industrials Overnight Futures are at -286. Here are the 90 minute charts going back 3 weeks for the overnight futures. You can see the big gap down tonight. It's crazy how all of the big investment banks are all intertwined with counter party Credit Default Swap risk exposure, and with Lehman insolvent it could bring big problems. There are some good articles about the counterparty CDS risk on bloomberg.com.
S&P Overnight Futures (insidefutures)
Dow Overnight Futures (insidefutures)
While I'm writing this news update just popped up. Bank of America Agrees to Buy Merrill Lynch for $44 Billion: WSJ- AP. That's a 38% premium to it's $21 book value for it's most recent quarter! Is BAC going to make MER write downs in the future??? It has to be related to the billions of counter party swap exposure because it doesn't seem like the right time to make a 38% premium bid over book value for a financial institution.
It will be interesting to see if the Bank of America/Merrill news out weighs the Lehman Brothers News. Of course if there is a deal for Lehman to sell the Neuberger Berman unit by Monday morning and survives, things might not be that bad!
And just think, it all started with the two Bear Stearns Subprime funds that blew up in July, 2007. Here's the letter Bear sent to shareholders, from the WSJ.
I can't stop posting about the indices because the market is at an inflection point of either a surprise rally or a HUGE move to the downside. I'm going to look at the long term trend and near term sentiment indicators, including the 25 year chart of the Dow and S&P 500 from barchart.com with technical analysis. Both charts show the 25 year long term trend line hitting today at lower levels. More significant in the S&P than the Dow. Click the pictures to zoom in.
Now looking at near term sentiment with options of the DIA and SPY (exchange traded funds) I see that implied volatility spiked recently due to the pending announcement of Lehman's fate, as well as problems with AIG, WaMu and issues with our economy . It looks like the SPY has more bearish sentiment than the Dow because it's Put/Call Open Interest ratio is much higher and it has very high open interest concentrations in some out of the money puts. The DIA has a Put/Call OI ratio of 1.03 and the SPY has a ratio of 1.57. Comparing the option volume, the DIA has more calls being traded than puts having a Put/Call Volume ratio of .78 (near year lows), and the SPY has a ratio of 1.40 which is a huge difference. If you look at the DIA Open Interest Configuration at schaeffers research there are actually some huge concentrated call positions at the Sep and Oct expiration's which is surprising. I'm thinking that the S&P 500 has more exposure to the banking sector giving it more negative sentiment.
Dow Jones Index 25 Years (barchart.com)
S&P 500 Index 25 Years (barchart.com)
SPY Open Interest (schaeffersresearch)
Also this just hit the Wall Street Journal at 2:00p Sunday (9/14/2008)..
"Barclays claims to be walking away from a Lehman deal but could return, sources familiar with the situation say. The current deal structure would require a Barclays shareholder vote. Government reluctance to provide funding remains a deal hurdle. More details to come." Full Article
This is a historical analysis of the Dow Jones Industrial Index during years 2000 and 2005. These were taken from a pdf I made that compared news stories from both years when the Dow Jones Industrial Index were in the 11,000 range. It's interesting to compare this to now where the Dow is close to the 11,000 level and that the index hasn't really increased in value for 10 years! Click on image to zoom in.
Due to the market chaos there seems to be a flight to quality in the treasuries. Now traders are even talking about a possible rate cut with commodities coming down, dropping the commodity inflation scare from the FEDs mind. I think there needs be a big flush to the downside to wash out all of the negative sentiment in order to restore the equity market. I wish there was some sort of debt liquidation price chart due to all of the reorganizations and huge bank debt blocks exchanging hands at distressed levels. I feel once this chart bottoms out the markets will be ready to move higher. I could only imagine the low ball bids being offered for Lehman's Neuberger Berman unit and it's commercial real estate portfolio due to the health of the market. It's pretty scary that these huge banking institutions are selling distressed assets to survive when they should be the ones providing capital to the private market and citizens. The billionaire funds better step into this market or there will be continued write downs as lending stays tight and our economy drags down the global economy.
I'm also wondering if the Bear Stearns, Fannie, Freddie and Lehman stories are the last to be told. The general economy could be the next story, but once the Lehman news of an asset sale, takeover, or government bailout comes out that could be the final flush or bottom. However if the economy's downside strength outweighs these large corporate restructuring catalysts it could take longer than expected. I've enclosed charts along with technical analysis of the U.S. Treasuries (source: barchart.com), Yield Curve (source: stockcharts.com) as well as the 10 Yr TIP spread (source: clevelandfed.org)
It looks like the Government is finally going subsidize the GSE's (Fannie Mae and Freddie Mac) and possibly lend $50B to GM. Local banking institutions keep going under and oil prices have been falling due to falling imports/demand, however the housing market could be stabilizing as housing inventories get worked off on a month to month basis. Still the August housing starts and permit data still shows weakness. The dollar has also improved. I believe currency traders are sensing a global slowdown, putting hard assets out of favor and putting a long bias into the USD. Also recently Fed officials believed the next rate move would be up. Things aren't looking that great for the consumer either with real personal spending and income not outpacing inflation and unemployment data reaching levels not seen for 5 years. Unexpectedly Q2 GDP was revised higher to 3.3% from the initial 1.9% reading, due to strong foreign exports utilizing the cheap US Dollar. The durable goods report in July increased 1.3%, which was higher than the 0.1% increase expected, due to foreign demand for commercial air crafts. However this could be a temporary phenomenon because a global slow down and a higher US dollar would lower exports. In the US increased unemployment and inflation data could affect real consumer spending further which would weaken retail sales data. Eventually the higher US Dollar and lower oil prices would lower inflation and lower the squeeze on the consumer's pockets.
The indices could revisit their old lows, or double bottom, if asset and debt liquidations continue and private institutions/overseas buyers fail to put an underlying bid on our country's distressed assets. I'm not sure how the market will respond if the GOV/U.S tax payers end up bailing everyone out (GM, Banks and GSE's). If the U.S tax payers buy all these distressed assets and hold on to them for years, the assets would eventually increase in value and the tax payers could receive a nice dividend check in the mail when the assets are sold back to the private enterprise at a profit! RIGHT?? So US tax payers are now a pooled distressed US investment fund putting a bid under the distressed assets, possibly saving the market and their home values. It's an automatic bottom with a short term cost. If the U.S Government would stop printing money and spending like crazy it could actually benefit us down the road. If that could only work.
News Flash:
Officials announce takeover of mortgage giants
Auto industry to press Congress for $50B in loans
U.S. unemployment rate hits 6.1%, highest level in five years
Oil hits 5-month low as demand shrinks
New-Home Sales in U.S. Increase From 17-Year Low
Durable goods post strong gains in June, July
Leading economic indicators fell sharply in July
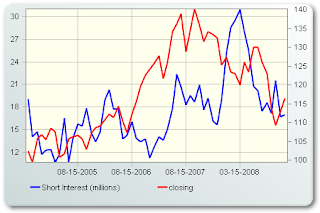
Here's a look at charts, sourced from stockcharts.com and schaeffersresearch.com, of the Dow Jones Industrials, S&P 500, and VIX (Volatility Index), with technical analysis for September 8, 2008. Also presented is the exchange traded funds SPY and DIA's short interest vs price activity, however it's data ending 8/15/08 which is about a month old. Short interest ending 9/1 could make a bounce. It looks like there's been short covering in recent months as well as a lower put/call open interest ratio, however according to Schaeffersresearch its still at 1.63 which is a heavily bearish bias.
It's interesting that the capital markets on Friday predicted the severity of Hurricane Gustav better than most of the weather stations who were predicting the next Katrina. Oil and natural gas prices, along with energy stock price actions, were predicting that Gustav wouldn't effect the energy infrastructure 3 days before it even hit. The anticipation of Gustav's force matching Katrina's did put a bid into energy prices and oil/gas stocks at the beginning of the week but it faded on Friday when the prices of oil and natural gas ended in negative territory. The market was right. Even though production was halted, Gustav caused limited damage to the Gulf's energy infrastructure and oil futures dropped over $7 as a result. The falling energy prices were also helped by a stronger dollar, lower demand and no direct international conflicts. Never Fight The Tape!!
This blog is for personal enrichment and informational purposes only. The information presented on this blog should not be used as advice to buy or sell securities and will not be held responsible for investment decisions made, or liable for losses incurred. The investments discussed on this blog may not be suitable for all investors and investors must make their own investment decisions based on their own investment objectives. There is no guarantee that anything discussed here, or data mentioned, is accurate, my blog entries are my personal opinion along with information used from various sources. These sources will not be held responsible for anything mentioned on this blog. Please contact your personal financial advisor for professional financial matters or subscribe to professional data services for your financial data needs. Please email me with any questions or concerns.