Wednesday, October 8, 2008

Nouriel Roubini - Possiblity Of Big U.S Bank Failure w/ Nationalization, On Tech Ticker

This is a must see, it's from Yahoo's Tech Ticker which is a great financial internet show. Roubini thinks there's a possiblity a big U.S bank could fail and become nationalized. This could hurt many institutions exposed which is scary, here's the video. I remember he was predicting this financial crisis in early 2007. I'm wondering when the Roubini trade will get too crowded though, we'll see if he continues to be spot on..


Embedded Video FromYahoo Tech Ticker


Here is info on Nouriel Roubini from his website http://www.rgemonitor.com/

"As Chairman of RGE Monitor, Nouriel provides strategic guidance for RGE Monitor's business and content. Professor Nouriel Roubini is an internationally known expert in the field of international macroeconomics. He is a Professor of Economics at New York University's Stern School of Business and is also the co-founder and Chairman of RGE Monitor, an innovative economic and geo-strategic information service named one of the best economics websites by BusinessWeek, Forbes, the Wall Street Journal and The Economist.

Professor Roubini served as a senior adviser to the White House Council of Economic Advisers and the U.S. Treasury Department; has published numerous policy papers and books on key international macroeconomic issues; and is regularly cited as an authority in the media. He received an undergraduate degree at Bocconi University in Milan, Italy and a Ph.D. in Economics at Harvard University, and was previously a faculty member at Yale University."

Tokyo Nikkei 225 Down 9.38% Last Night, Coordinated Global Rate Cuts

The Tokyo Nikkei 225 Index lost 9.38%, closing at 9202.32. This shows that the financial crisis is global. Here's the 5 day Nikkei chart from Yahoo Finance, and it has followed the S&P.. Also many central banks around the world decided to cut rates..
"Fed, central banks cut rates to aid world economy

The Fed reduced its key rate from 2 percent to 1.5 percent. In Europe, which also has been hard hit by the financial crisis, the Bank of England cut its rate by half a point to 4.5 percent and the European Central Bank sliced its rate by half a point to 3.75 percent. The central banks of China, Canada, Sweden, and Switzerland also cut rates. The Bank of Japan said it strongly supported the actions."


I'm thinking there has to be a an upside correction sometime soon in all markets... We'll see.

Tuesday, October 7, 2008

LIBOR Rates Update, How It Relates To The Consumer (3 Month Chart, Articles)

Since the LIBOR rate is all over the news and affecting the global financial system, I wanted to post some charts and information. LIBOR is the London Inter-Bank Offered Rate. Here's a description of the rate and why it's often used, along with a nice flash graphic below.


"Libor, set every morning in London, is what banks pay to borrow money from each other. That in turn determines prices for financial contracts valued at $393 trillion as of Dec. 31, 2007, or $60,000 for every person in the world, and helps set consumer interest rates on everything from home loans to credit cards.

Corporate bank loans are often linked to three-month Libor rates. Libor also affects interest costs on credit cards, student loans and adjustable-rate mortgages. From 2004 to 2006, more than half of the U.S. subprime mortgages at the root of the financial crisis, or those issued to the least creditworthy borrowers, had adjustable rates linked to Libor, said Guy Cecala, publisher of Inside Mortgage Finance in Bethesda, Maryland." Source: Bloomberg.com, 10/3/2008


Click For Larger Image, via Bloomberg Link


This rate is very important because it measures liquidity risk between banks. Because of so many bank failures recently in the U.S and Europe, banks were unwilling to shell out 3 month loans to other banks because of solvency risk. As a result 1 month and 3 Month LIBOR rates spiked, making it more expensive to borrow money. As stated in the description above, the 3 Month LIBOR rate is linked to corporate bank loans, as well as consumer loans including adjustable rate mortgages. Here's a recent chart of the 3 Month LIBOR rate and you can see it spiked recently due to the financial mess.


3 Month LIBOR Rate Chart (Source: Tradesignals.com)


It's pretty crazy that 3 Month LIBOR increased 50% from 280 basis points (2.8%) in mid September to 420 basis points (4.2%) today. That is a dramatic increase, and since adjustable rate mortgages are tied to LIBOR, some home owners could see higher monthly payments which could squeeze household debt coverage. Plus heating costs are expected to increase by 15% this winter. Here's a quote from another Bloomberg article today, "Libor Rise to Boost Subprime ARM Defaults 10%, Citigroup Says".


"Oct. 7 (Bloomberg) -- Increases in benchmark London interbank offered rates may boost homeowner defaults on resetting adjustable-rate mortgages, contributing to a ``vicious cycle'' in the credit crunch, according to Citigroup Inc.

Among subprime loans, defaults may climb by 10 percent, analysts Rahul Parulekar, Udairam Bishnoi, Sumeet Kapur and Tanuj Garg wrote in a report yesterday. About $23.7 billion, or 87 percent, of the ARMs underlying bonds whose interest rates begin adjusting next month track Libor rates. Six-month dollar Libor has climbed to 4.02 percent, from 3 percent on Sept. 15.

The deepening of the credit crisis that started last year amid record defaults on subprime mortgages, contributing to $593 billion in writedowns and losses at banks worldwide, may end up causing more borrowers to fail to make their monthly payments. Libor rates, which track how much banks charge each other for loans, help set the cost of everything from credit cards to corporate loans."


If LIBOR doesn't see a relief correction, it would not only create more defaults, but kill consumer spending, and less spending means less profits, and less profits means more layoffs. There's the Fibonacci spiral again.....

On a more optimistic note, the Fed saw the situation and acted quickly. On Monday, since LIBOR was double the Fed's overnight target rate of 2%, the Fed announced a new commercial paper funding facility to provide 1-month and 3-month liquidity to relieve the pressure on short term borrowers. Hopefully this will take the risk premium out of LIBOR.

Bernanke's Outlook For Economic Growth Has Worsened

"Bernanke: Economic outlook weaker: Fed chairman says financial crisis will dampen economy well into 2009 and hints at future rate cuts; says recent actions by Fed, Treasury should help economy recover." CNN Money

Here is a video link of Bernanke's speech at the National Association of Business Economics conference giving his economic and inflation outlook..


Also to note, the S&P closed below the key 1,000 level today, at 996.23... We need this rate cut, for a possible confidence boost atleast. It seems like forced institutional selling (domestic and international)..


Also check this out, Warren Buffet on Derivatives: Excerpts from the Berkshire Hathaway annual report for 2002. PDF Link

Interesting Article About Market Sentiment & Time Magazine Cover

I came across an interesting article from tradingmarkets.com, "Sentiment Now Bearish As All Heck". Gary Kaltbaum talks about many sentiment indicators of a market bottom, and backs it up with 7 reasons. By the way, the Dow at 3:00est is down 311 points to 9,643 and the S&P is down 35 points to 1021 and "Bernanke sees worsening economy, hints at rate cuts".

"I just want to note that all the reactions we usually see at near term lows are being put in place. I did not say bear market bottom... and nothing is 100%. First off... here is TIME MAGAZINE!" Continue with article.

Source: Time Magazine Cover 10/13/08

Jim Cramer on the Colbert Report (10/6/2008 Video)

Stephen gets insight on the turmoil of the financial markets from Jim Cramer, host of CNBC's "Mad Money." 21:43 minutes


Monday, October 6, 2008

Will Fed Lower Rates? Technicals of Fed Fund Futures Chart, Options & Curve

There's talk on the street that the U.S. will cut the Fed Funds rate, possibly coordinating with other foreign central banks. Here are quotes from the Bloomberg article: Treasury 2-Year Gains Unstoppable as Fed May Cut Rate (Update2), plus a CNBC video with Diane Swonk @ Mesirow Financial.

``My biggest concern has been and continues to be that the real economy is going into the doldrums,'' said Thomas Girard, a money manager who helps oversee $110 billion in fixed income assets at New York Life Investment Management in New York. ``That ultimately leads the Federal Reserve to lower rates, maybe over the next six months by 100 basis points, and if that is the case Treasury yields will decline.''

"Goldman Sachs economists predicted on Oct. 3 the Fed may lower its target by 1 percentage point in coming months. The firm previously expected policy makers to keep rates unchanged."

Here are charts from barchart.com that show the Fed Fund Futures Chart, Options and Curve. It should be noted that the Call/Put Premium Ratio is 63.50..

Fed Fund Futures Chart Trend (Source: Barchart.com)


Fed Fund Futures Option Chain (Source: Barchart.com)


Fed Fund Futures Curve (Source: Barchart.com)


CNBC Video w/ Diane Swonk of Mesirow Financial

Video re-directs to CNBC.com

Jim Cramer: Time to get out of the stock market (MSNBC Video)

The Dow Jones Industrials just broke through a major 10,000 support level, which was created from the '94 and '02 lows. Jim is saying we could fall 20% from here and he could be right if we don't see a capitulation volume day with a reversal over 10,000. The post '87 crash to '94 bottoms, disregarding the tech bubble lows, brings us to 8,000 on the Dow, which is about 20% below today's levels. Click the chart for a larger view of these trends. If massive hedge fund redemption's occur and European banks keep failing, it's hard to tell what could prop up this market.

Jim Cramer on MSNBC (10/6/08)


Dow Broke Long Term Trend (Source: Barchart.com)

Sunday, October 5, 2008

An Idea To Prevent The Next Credit Default Swap Illiquidity Crisis

In order to prevent this financial massacre from happening in the future there must be capital and collateral ratio requirements that CDS counterparties must follow in order to sustain their ability to honor existing swap obligations if portfolio holdings get distressed. I'm sure Lehman, AIG and Bear had risk controls in place, but they obviously did not factor in any type of credit disaster risk. If anyone reading this knows about CDS risk management practices please comment. Credit ratings agencies and institutional buyers thought these pooled mortgage backed securities diversified away risk, however too much bad risk (sub-prime debt) was concentrated in these securities and cash stopped flowing in, so the A rated securities were written down to distressed levels.

These counterparties must have the ability to honor existing swap obligations or be forced to sell the obligation to another party or raise additional capital. There must be liquid collateral posted to the par value of these obligations to easily calculate a ratio breach.. If there were conservative ratios in place I'm sure these forced bankruptcies and counterparty ripple effects would have never happened. If these swap counterparties violate a conservative CDS Obligation/Liquid Collateral Value ratio (kind of like how the home builders breached their debt/tangible net worth ratio bank covenants when they kept writing down land values) they must transfer the obligation to another party within a certain time period, or be forced to raise capital or post additional liquid collateral to cover the ratio breach. I'm sure there could be ways to incorporate the underlying securities if they were to be swapped in a default, incorporating CDS par value-underlying market value into the ratio. Again I'm not sure how these transactions are structured. I'm wondering if this could work and what affect it would have on the CDS market and spreads. I also want to know how the illiquid CDS obligation would be transferred to another party since it could bring massive risk to a new party. What if nobody wants it and they can't raise capital?? Could it be transferred in pieces?

This would force financial institutions to deal with their liquidity problems quickly and efficiently, instead of creating a cross-default domino effect like we saw last month. Indirectly these banks were not hedging away their default risk which needs to be addressed for the future health of the CDS market, and the next debt security crisis, when everyone wants to buy an aircarhome in 2108..

Here's an interesting write up on SeekingAlpha: How Banks Hedge Counterparty Risk

Dow Index Analysis, 10,000 Key Long Term Support Level, Falling Wedge

Looking strictly at the technicals, 10,000 is the next major whole number for support as well as the 2004 and 2005 lows. On Friday the Dow closed at 10,325, breaking last week's low of 10,365 when the Dow lost 777 points in one day. So that breach might mean we continue lower, of course it all depends on how traders digest the bail out. Looking at the chart, it seems the Dow is in a falling wedge pattern in an underlying downtrend. Usually these patterns predict a corrective reversal but requires some sort of catalyst for the wedge to squeeze the crowded trade, which is around 10,250 on the chart. However, eventually the long term trend prevails, and if there is a corrective reversal I'd like to see a successful re-test of the reversal point to tell if we're ready for an uptrend. If there are serious issues with our economy, the Dow could break down from that wedge and test 10,000, which is where the '94-'02 trend hits today. Any type of correction could be delayed due to the short sale ban affecting a squeeze, or institutional capital staying on the sidelines. There is also a second trend which tracks the lows of '87 and '94, and it hits today at about 8,000. So hopefully the state of our economy is almost priced into the indices and we don't break below 10,000...And hopefully the Fed doesn't have to subsidize the labor force!


Dow Index: Falling Wedge (Source: Barchart.com)


Description of Falling Wedge Reversal (Source: Sharp2be)


Dow Index: 25 Year Chart w/ Trends (Source: Barchart.com)


I also posted about this on Sep 13, 2008, http://distressedvolatility.com/2008/09/long-term-dow-s-technicals-near-term.html.

Saturday, October 4, 2008

Conversation with Jamie Dimon (CEO J.P Morgan) on Charlie Rose (July, 08)


Interviews with Jamie Dimon (CEO of J.P Morgan) on Charlie Rose. Jamie Dimon and Henry Paulson of the U.S Treasury were responsible for the emergency bail out of Bear Stearns in March, 2008, which could've had catastrophic consequences if left to go bankrupt.

Jamie Dimon, Part 1 - 7/7/2008


Jamie Dimon, Part 2 - 7/8/2008

Friday, October 3, 2008

Exclusive Conversation With Warren Buffett on Charlie Rose (10/1/2008)


Charlie Rose Interview: 10/1/2008


Charlie Rose Interview: 5/10/2007

Thursday, October 2, 2008

Surprisingly XLF and XHB Have Outperformed SPY In Last 3 Months

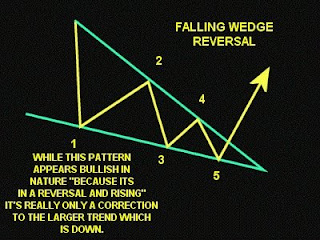
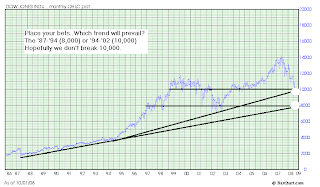
This economic bail out news is now a national joke on network tv and I'm starting to believe that negative sentiment right now is a coiled spring, and if the House passes this bill the $VIX will be sold off hard and the Dow could rally 1000 points, atleast in the short term. The indices are brushing up against the 15 year trend line and Warren Buffett is loading up on the best of breed. Of course the House needs to pass this bill in order to restore market confidence, or we will see, what Warren Buffet says, the "economic Pearl Harbor", and the rug under the US indices will be pulled.

What's surprises me is that the XLF and XHB have actually outperformed the SPY over the last 3 months, when IndyMac, Fannie, Freddie, Lehman, Merrill, AIG, WaMu, Wachovia all lost their lives. What else could seriously go wrong, besides the economy spiraling into a black hole. The XLF was up 9.92% and the XHB was up 27.8% on the SPY during the last 3 months! How crazy is that?? Shouldn't hedge funds be making those returns on the S&P and not sector index funds?


SPY vs. XHB & XLF 3 Month Chart (Source: Bigcharts.com)


Looking specifically at the XLF, it needs to clear above the $20 support level with strength to catch a major bid, and it needs to break above the downward trend. Plus you can see two capitulated lows on those volume spikes (between $15-20). That could in fact be a double bottom but it seriously depends on this bail out, which will unfreeze the banks and bring liquidity back to main street. If the bailout fails again confidence will not be restored and we'll probably see another volume spike to the downside.


XLF 4 Year Chart (Source: Bigcharts.com)


The XHB has been in the $15-25 range since last August. It hit all time lows ($15) this July, and since rallied to $20 even during the September mortgage/bank massacre. It looks like there's a floor between $15-20, and again if the bill passes it will provide liquidity to the mortgage market as the tax payers scoop up the worthless mortgage paper from the banks, which would allow builders to work off existing inventory and raise cash.


XHB 4 Year Chart (Source: Bigcharts.com)


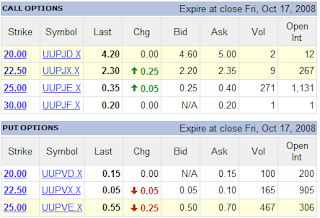
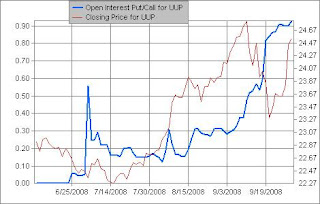
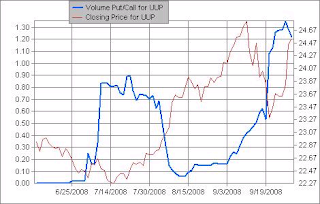
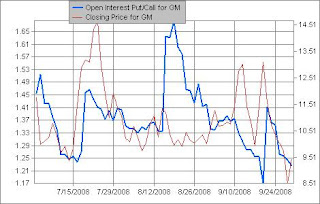
These last charts show investor sentiment indicators of XLF. The chart below shows XLF Implied Volatility spiking recently. It's implying a big move ahead and I'm pretty sure volatility is being bid up in anticipation of the House vote. Either way once the news is out IV will be sold and the XLF will move in the appropriate direction. The XLF put/call open interest ratio is at 0.82 which is bullish bias and you can see the open interest configuration below with the large chunks of out of the money calls open. Plus short interest has been breaking down since June. So it will be interesting to see what happens here, and hope for the best.


XLF Schaeffers Volatility Index (Source: Schaeffersresearch.com)


XLF Put/Call Open Interest Ratio (Source: Schaeffersresearch.com)


Go to Schaeffersresearch.com for great option data and charts.
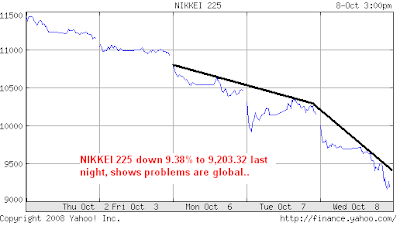
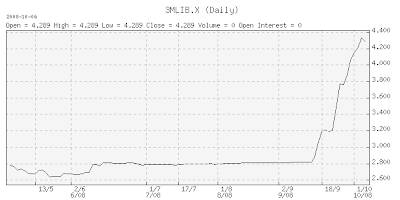
PowerShares Bullish U.S Dollar Index (UUP), Options Pegged At 25 With Rising Put Activity

The previous post looked strictly at the technicals. Looking at the options of the PowerShares US Dollar Index Bullish (UUP), calls vs. puts open going out until December favor a price of $25+ (less premium)...

UUP October Options (Source: Yahoo Finance)

UUP December Options (Source: Yahoo Finance)

However, during the past month of September, put/call volume has been increasing, as well as the put/call open interest ratio which shows the presence of bears. Plus the Schaeffer's volatility measure is moving higher and there's a load of shorts.. Will call volume spike and UUP break out of resistance????? We'll see how UUP reacts to the house vote.

UUP Put/Call Open Interest Ratio
UUP Put/Call Volume Trend

UUP Schaeffers Volatility Index

Chart Sources: Schaeffersresearch.com

U.S Dollar Index at 80 Resistance...House Vote Is Catalyst

Futures down, US dollar up... U.S Dollar Index is at 80-81 resistance, will house vote catalyst allow USD to pierce through that level?

US Dollar Chart (Source: Barchart.com)

It's interesting that DOW futures are down 1.3% (-138) to 10,752, and the US Dollar is up .07% (.555) to 80.09 tonight after the Senate passed the revised bailout bill. It's tough to say what will happen with the USD when the House vote catalyst hits the wire. What is currently driving the bid in the USD? Is slowing global growth overpowering the USD dilution/economic growth fears? Plus there's a chance that the European Central Bank might lower rates, which could also bring support to the USD.

"European Central Bank President Jean-Claude Trichet has stated his strong support for the US effort saying that the must “go (in favor), for the sake of the U.S. and for the sake of global finance.” Such statements have led some to believe that today’s ECB meeting will result a rate cut. Furthermore, the Euro hit a low of 1.393 ahead of the key meeting."

We'll see how the USD reacts to the catalyst and if it can pierce through resistance at 80 - 81... If traders react negatively to the vote, the USD could correct to 78 - 76.

Here are US Dollar bets from a Bloomberg Article I read tonight..


Dollar Bullish
``Market consensus is that the bill will eventually pass in some kind of form,'' said Akifumi Uchida, deputy general manager of the marketing unit in Tokyo at Sumitomo Trust & Banking Co., Japan's fifth-largest bank. ``The package is likely to reduce worries over the U.S. and bolster the dollar.''

``The Senate's approval may alleviate concerns over the U.S. a bit,'' said Tsutomu Soma, a bond and currency trader at Okasan Securities Co. in Tokyo. ``It's supportive of the dollar.''

``The ability to secure funds in the money market hasn't improved in the slightest,'' said Akio Shimizu, chief manager of foreign-exchange trading in Tokyo at Mitsubishi UFJ Trust & Banking Corp., a unit of Japan's largest publicly listed lender. ``This should support the dollar as banks that need the currency will simply buy it outright in the foreign-exchange market.''

Dollar Bearish
``U.S. stock futures are down a lot after the vote, and that's one reason to sell the dollar,'' said Motonari Ogawa, director of currency trading in Tokyo at Barclays Capital Inc., a unit of the U.K.'s third- biggest bank. ``There's still some doubt whether this bill will pass the House.''

Wednesday, October 1, 2008

GM Exchange Traded Notes Being Dumped (What's The Logic Here?)

I've been watching the exchange traded notes of General Motors (hgm, xgm, gms) get smoked during the last month. What's interesting is that these debt securities have lost more value than the common stock. From the chart below, during the full month of September, the XGM exchange traded unsecured senior debt security lost 23% vs. the GM common stock.

1 Month Change GM vs. XGM (unsecured debt)
(Source: bigcharts.com)


I'm trying to figure out the logic behind the debt and equity trade. I know the ETN's are unsecured, but still the senior unsecured's would be higher up on the entitlement ladder than the common equity during a reorg or liquidation. So why is the retail debt being sold off more than the common stock? In the debt's case, I'm thinking the $25 Billion Government loans are more senior than the unsecured retail debt, and without the $700 Billion bank bailout auto lending would remain frozen. Looking at the numbers ended 6/30/08, GM had a net worth of -$57 Million, with $74.5 Billion in current liabilities, $35.2 Billion in long term debt and $81 Billion in "healthcare/pension/other liabilities". Adding $8.3B loan to the debt load would probably put the $4.7B of total ETNs at risk of recovering capital in bankruptcy. Also a week earlier GM tapped $3.5 Billion from it's existing credit line, which shows they're still desperate for cash.

But none of this makes sense because the equity is not pricing in this risk, even though it did touch a new all time low of $8.51 when the market lost 777 points yesterday. GM closed at $9.45 today, unchanged from the mid July lows. Also GM flipped over it's balance sheet these past few weeks by diluting common equity to pay down debt. GM was able to issue 44.3 Million shares to exchange for the $498.3M principal on their Series D Senior Convertable Debentures due 6/09. The fact that this institutional buyer would exchange hundreds of millions of debt for equity at this point is basically saying there's a light at the end of the tunnel for the common shareholders. SEC Filings (9/19, 9/29). GM also plans on raising $2-4B to boost liquidity by selling off assets including the Hummer Brand, Strasbourg manufacturing operations and land. Looking at Schaeffers Research volatility and options data during the past 21 days, GM volatility spiked to all time highs this past week, the Put/Call volume ratio increased from .93 to 1.07, and the Put/Call open interest ratio stayed relatively stable at 1.23 which is a slightly bearish bias. Put open interest and volume actually spiked on 9/22 but tapered off since then. The short interest chart has also been correcting. So there's a tug-of-war going on between positive and negative sentiment, and it could be that GM volatility will ultimately be sold and the stock bought in the short term if congress gets the bail out package passed, however a spike in option volume could go in either direction. So are these retail bond holders dumping to take the loss to load up on the common, are they forced institutional sellers, or are they seeing a bankruptcy hearing around the corner??? We'll see..

GM Volaility Index (Schaeffersresearch.com)


GM Put/Call Volume Ratio (Schaeffersresearch.com)


GM Put/Call Open Interest Ratio (Schaeffersresearch.com)